A central log system can greatly enhance an organization’s ability to manage, monitor, and troubleshoot its IT infrastructure efficiently while also improving security, compliance, and collaboration among different teams. It helps in different areas which include but are not limited to centralized data collection, simplified troubleshooting, real-time monitoring, scalability, cost efficiency, standardization, improved collaboration and comprehensive monitoring. Loki is a tool that combines all the mentioned functionalities and much more.
Loki is a powerful open-source logging system designed for collecting, storing, and querying log data generated by applications, services, and infrastructure.
The system is horizontally scalable, meaning increasing workloads and data volumes by adding more resources or instances, such as additional servers or nodes, rather than relying on vertical scaling (upgrading a single server’s resources), which contributes to the overall system’s capacity, performance and cost efficiency.
In short, with Loki, you can collect, store and search logs.
Business Benefits
Gotoadmins DevOps engineers create customized centralized logging system setups with Loki and Grafana which are used for both internal and external projects, which means that the integration with your application would be a quick seemingless set-up.
Integrating Loki into your infrastructure can offer several compelling perks to a business, enhancing the ability to manage and monitor the systems effectively. Here are some key benefits to consider:
- Alerting – Integration of Loki with alerting systems like Grafana enables proactive alerts to be set up based on specific log events. Potential issues can be identified and addressed before they impact a business.
- Realtime – Real-time monitoring of log data can be conducted with Loki, enabling issues to be identified and responded to as they occur. Downtime can be minimized, user experiences can be improved, and revenue loss due to outages can be prevented.
- Integrations – Loki is very versatile and is natively integrated with tools and services like Grafana, Prometheus, Kubernetes and also works with any other infrastructure setups in any major Cloud Provider
- Scalability: As a business grows, Loki can be easily scaled horizontally to accommodate increasing log volumes. Additional resources or nodes can be added to handle higher workloads, ensuring that your logging system can keep up with demand.
- Speed – Loki works very fast and can start querying and get results in seconds.
- Open-Source & Community-Driven – This means a business can benefit from continuous development, community-contributed features, and ongoing improvements
- Dynamic Labels – Loki allows dynamic labels for log entries, making it easier to tag and categorize log data. This feature is invaluable for managing logs in dynamic, containerized environments where labels may change frequently
Business Example
An e-commerce business has been experiencing performance issues with its online shop platform. The platform has grown in complexity, with multiple microservices handling various aspects of the shopping experience, including product listings, shopping carts, and checkout. However, the company is struggling to identify and resolve performance bottlenecks that lead to slow page load times and increased cart abandonment rates. These issues are impacting user experience and, ultimately, revenue.
Solution with Loki:
- Real-Time Log Analysis: The e-commerce business deploys Loki to centralize and analyze log data from all microservices in real-time. This allows them to monitor user interactions, system activities, and performance metrics in a unified manner.
- Setting alerts: The company sets up alerts using Loki to trigger notifications when specific performance thresholds are breached. For example, if the average page load time exceeds a predefined limit or if cart abandonment rates spike, an alert is triggered, enabling the team to respond promptly.
- Distributed Tracing: Loki’s integration with distributed tracing tools assists in diagnosing issues that span multiple microservices. The team can correlate logs with traces, making it easier to understand the flow of requests and identify bottlenecks across service boundaries.
- Performance Optimization: Using Loki, the platform’s DevOps and engineering teams can identify performance bottlenecks by creating custom dashboards and visualizations. They can track response times, error rates, and resource consumption across various services and pinpoint which microservices are causing delays.
With Loki in place, the e-commerce platform’s DevOps and engineering teams can quickly detect and resolve performance issues, leading to faster page load times and a more responsive shopping experience. By setting up proactive alerts and utilizing Loki’s monitoring capabilities, they can reduce cart abandonment rates and retain more customers.
In this real-life business case, Loki helps an online shop platform address performance challenges, improve user experience, and ultimately enhance its revenue-generating capabilities. It offers a comprehensive solution for monitoring, analysis, and troubleshooting in a complex, microservices-based environment.
How it looks in practice
In this example, a simple Nginx setup with PHP will be shown (a simple web server – Nginx, and a backend application to serve requests – PHP), whose purpose is to track the response time of our application. The aim is to track the time from the moment the Client makes a request to an application until page results are sent back to them.
Let’s imagine the abovementioned setup in place, first, the log level in the Nginx settings has to be increased so that the logs will output more information (another option includes having a custom log configuration to log specific things and in a specific order).
After the web application is in place and Loki is ready to receive logs from the Nginx service, querying can start and the response time of each request can be checked.
Here is a picture of the logs visualization in Grafana with Loki:

The two entries in the end which both end in seconds are respectively:
- Request time – Full request time, starting when NGINX reads the first byte from the client and ending when NGINX sends the last byte of the response body
- Upstream response time – Time between establishing a connection to an upstream server and receiving the last byte of the response body
Next, a query which searches and highlights these two variables can be created:

There are also options to run operations on these logs to get the average response time for an application (or for applications, if multiple of them are present, in this case, the average response time of each application separately can be shown)
Here the max time requests can be seen and weed out any requests that took a long time to process:

The reason to do so is to add alerts afterwards as well.
Consider the scenario where notifications are required for instances where one or more requests in an application have experienced delays or failures; Loki allows you to configure alerts to fulfil this need.
When a request has taken too long to process or has timed out, a notification like the one below will be received:
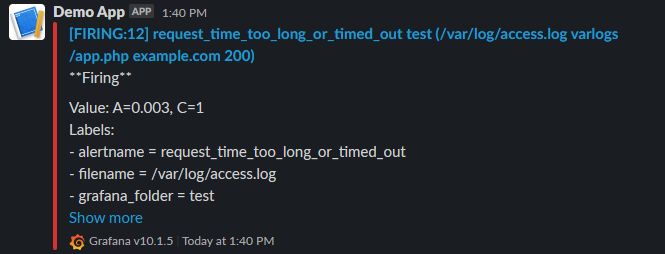
The example above shows a notification received in the platform Slack, but Loki could be configured to send notifications to any platform (including Discord, Email, Telegram, and many other built-in options as well as configurable webhooks).
When the issue is resolved, it should look like this:
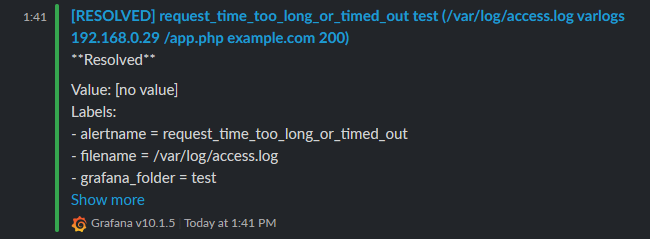
Alerts for any type of anomalies occurring in an application can be created and a response could be done immediately to errors or issues an application might be experiencing.
Moreover, Custom Templates can be created and the alerts can be viewed in a more detailed manner and tailored to any specific requirements.
This is just an example of how a business can integrate and use Loki for its own benefit.
The following paragraphs will introduce a Loki guide, providing step-by-step instructions for initiating queries.
How to use
Loki is known for its user-friendliness and ease of use, catering to a broad spectrum of users, ranging from IT specialists to business owners and those with limited technical expertise, making it accessible to anyone seeking desired results.
If you lack experience with Loki or possess no technical knowledge, there is no need for concern, as a step-by-step guide will be presented below on how to utilize Loki.
To utilize Loki, the Grafana dashboard link provided to you should first be accessed, followed by logging in with your credentials. Upon logging in, the Loki option can be found by selecting “Explore” from the left panel.
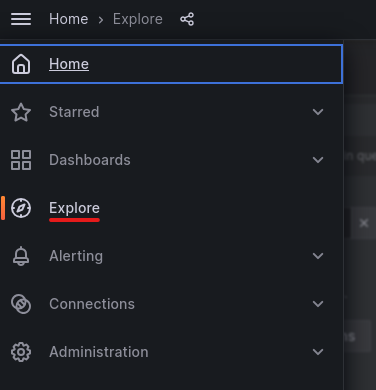
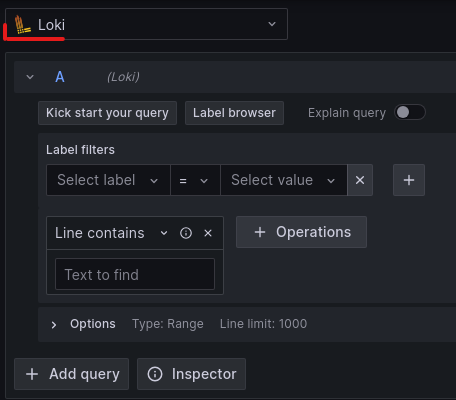
The query setup for initiating the search for logs from the services scraped by Loki will be presented to you immediately.
Here, the process of searching for specific logs and creating queries will be explained.
To begin, a Label and a corresponding Value need to be selected to identify the logs to be viewed.

In this case, the Label can be the name of a File which logs are being scraped from, or a Job, which is a specific job that can have multiple targets to scrape logs from. An example would be having a job named Nginx, which would scrape the logs from multiple Nginx services, and have another job named Database, which could be set up to scrape logs from multiple databases.
After selecting the Label, add a value to it.
If the Label “Job” is chosen, the input of the specific job from which the logs are to be viewed will be required as the corresponding value.

On the other hand, if “Filename” is selected as a Label, the specification of the file from which the logs are to be viewed will be required as the corresponding Value.
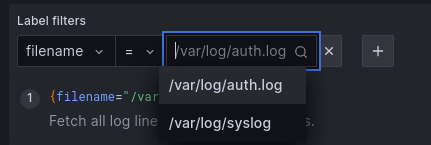
NOTE!
You could have different Labels depending on your infrastructure, but the logic remains the same.
Once the decision has been made regarding the source from which logs are to be viewed, a query must be executed to extract the desired information from the logs.
Now Operation needs to be added.
An Operation is a function that will match something specifically based on what you have required. For example:
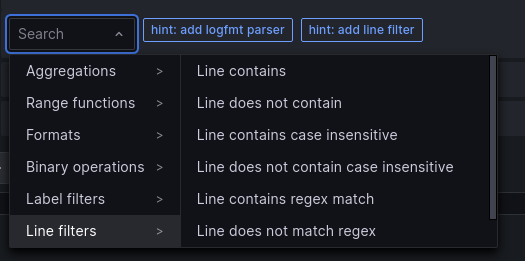
Any type of Operation could be added, with a wide range of options to help pick out the specific logs you need.
You can add any number of operations, which will get the output from the last operation.
Another example here:

In this example, the query first will search for all the lines that contain the word “test” in it, and afterwards, it will run another operation on the results of the first operation, but this time to remove all lines that have the word “data” in it. So the log entries should contain the “test” string, but not the “data” string.
Another way this can be used is for example to search for a specific string, and then the output of the first operation to be formatted into a specific log format:

Other types of formats it can convert to are json, regex, etc.
After adding your operations, you can simply use the button on the top right corner “Run query”,
to run the query and see the results when scrolling down.
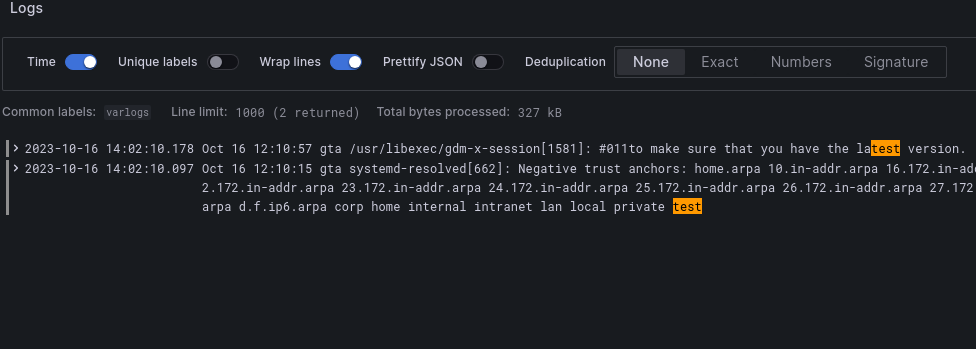
Above is an example of how logs would look after running a Query.
You can also click on a specific log to find out more information about it.

Here you can see when clicking on the log above, that it will show which file it was scraped from, and also which job is doing the scraping of these logs.
If you want to run multiple queries at the same time, then simply click on the “Add query” button and start setting it up based on what you’re searching for.
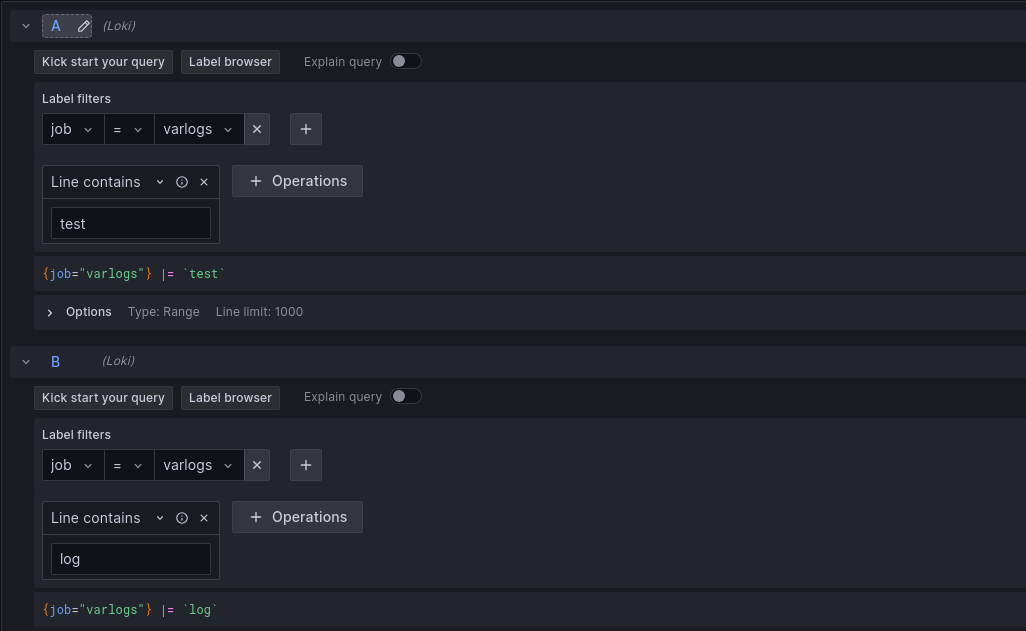
In the example above, two queries are being simultaneously executed on the same Label.
In the first query, lines containing the word “test” are being sought, while in the second query, lines containing the word “log” are being sought.
The results of the logs will show entries from both queries:

You can search for any time range that you need to from the top right bar:
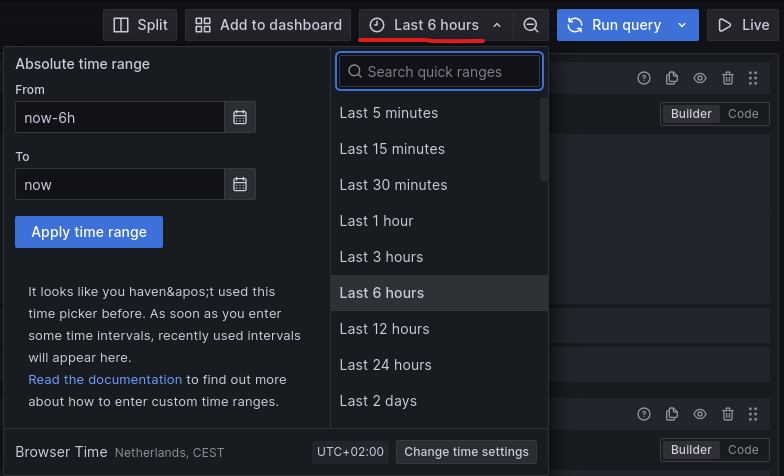
The “Live” button on the right side will start livestreaming the logs, so you can see and follow them in real time while you are testing.
Conclusion
Loki is an all-around great tool used in many different cases, it has little cost due to efficient log storing methods, and can be used by anyone!
It is useful when used to troubleshoot the application (on the developers’ side), and even on large scales, since you can get only the specific logs you need in a very short time, not to mention Loki’s powerful ability to track different events that you might encounter in your production environments.
With all this information at hand, there’s actually no reason to not use Loki. Other logging methods could also be used, but none have the comfort and reliability that Loki brings.
